Chart Line
Description
Chart-line is a chart which displays dynamic of creation records of some entity, users, orders, comments etc. Chart can display daily or monthly results.
Configuration
This page adds two independently named line charts. The first chart counts recent registrations; the second uses the first route-tail value as a role criterion.
Open /adminix/user-registrations/2 to scope the monthly chart to role 2. To add to the page Chart Line module you need paste AlexKudrya\Adminix\Modules\ChartLine\ChartLineModule class instance as an argument to addModule or addModules method of AdminixPage object.
ChartLineModule Configuration
Method | Description | |
|---|---|---|
title | Title of the chart on top of this module
title('USER REGISTRATIONS DAILY')
| Optional |
name | Name of module, must be unique in current page.
name('user_registrations')
| Required |
color | Color of lines in chart, can be provided only by
color(ColorsEnum::DEEP_PINK)
| Required |
valueType | Type of interval for records counting. Can be provided only by
valueType(ChartLineValueTypeEnum::COUNT_DAILY)
| Required |
baseField | Field with date / datetime (usually it is a record creation timestamp). By default, it is
baseField('created_at')
| Optional |
dataSource | Source of data for chart, can be an
dataSource(\App\Models\User::class)
| Required |
criteria | Database
criteria([
['role_id', '!=', 1],
])
Or you can paste parameter from route:
criteria([
['role_id', '=', 'param:0'],
])
For example, for | Optional |
yAxisStep | Optional Y-axis tick step. When it is omitted, Adminix leaves the Chart.js axis scale automatic. Set it when the metric has a natural minimum step, for example count charts that should show whole numbers only.
yAxisStep(1)
// or, for fractional metrics:
yAxisStep(0.5)
| Optional |
limit | limit of days / months for displaying in the chart
limit(30)
| Required |
Appearance examples
Here is an example of Users daily registrations (value_type = count_daily, limit = 30)
Rendered example:
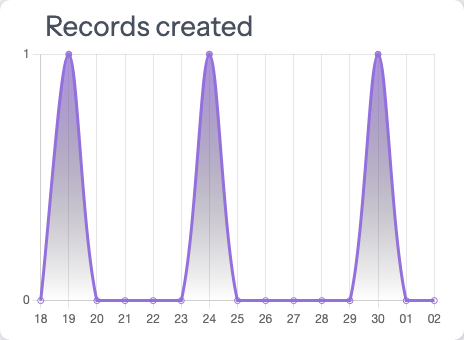
The rendered canvas has an accessible name and an equivalent visually hidden label/value table, so the series remains available when a browser cannot expose canvas pixels.